
You've invested time and resources into your nonprofit's website. It looks great, tells your story, and showcases your impact. But how do you know if it's actually working?
Unlike for-profit businesses that focus primarily on sales and revenue, nonprofits need different ways to measure success. Your metrics should reflect your unique mission and the diverse ways supporters engage with your cause.
Many nonprofit teams struggle to identify which numbers actually matter. With limited time and resources, it's easy to get overwhelmed by data that doesn't translate to meaningful insights. You might wonder: Are we tracking the right things? What do these numbers actually tell us about our mission's progress?
This guide will help you focus on metrics that truly matter for your nonprofit's success. We'll explore practical ways to measure your website's performance, understand what the numbers mean, and use that knowledge to make smarter decisions that advance your cause.
Why Metrics Matter for Your Nonprofit Website
Your nonprofit website design serves as the digital hub for your mission. When someone wants to learn about your work, donate, or get involved, they often turn to your website first. The performance of this digital doorway directly impacts your ability to fulfill your mission.
Many nonprofits focus solely on pageviews, but this barely scratches the surface of what you can learn.
Here’s what happens when you harness the right data:
- Deeper Insight into Your Audience: Meaningful metrics help you understand not just how many people visit your site, but who they are, what they care about, and whether they're taking actions that support your cause.
- Smarter Decision Making with Limited Resources: When you know which pages inspire donations, which volunteer opportunities attract the most interest, or which stories resonate with your community, you can focus your efforts where they'll have the greatest impact.
- Enhanced Communication: Being able to show donors, board members, and other stakeholders concrete results helps build confidence in your organization's effectiveness and can strengthen your case for continued support.
However, tracking too many metrics—or the wrong ones—can be just as problematic as tracking none at all. You might get lost in numbers that don't actually help you advance your mission. The key is finding the sweet spot: enough data to guide decisions, but not so much that you're drowning in reports.
For guidance on evaluating and improving your nonprofit website:
- Nonprofit Website Audits: A Comprehensive Guide for Evaluation
- 21 Nonprofit Website Best Practices [With Real-life Examples]
- User Journeys for Nonprofit Websites: Understanding and Improving the Donor Experience
Mission-Focused Metrics Framework
The first step in measuring your website's success is making sure your metrics align with your organization's mission and goals. A youth mentoring program, an environmental advocacy group, and a community food bank will each have different definitions of success—and therefore different metrics that matter.
When building your measurement framework, think about your metrics in three main categories:
- Awareness Metrics: These metrics tell you if your message is reaching people. These include overall website traffic, new visitors, and search visibility for terms related to your cause. They help you understand if people can find you when they're looking for organizations like yours.
- Engagement Metrics: These numbers show if people are connecting with your cause. These include time spent on key pages, email sign-ups, resource downloads, and social shares. Strong engagement suggests your content resonates with visitors and they're interested in learning more.
- Conversion Metrics: This data tracks if people are taking meaningful action. These include donations, volunteer sign-ups, event registrations, and advocacy actions. These metrics most directly connect to your mission advancement.
The patterns between first-time and returning visitors offer valuable insights. First-time visitors show your reach is growing, while returning visitors indicate you're building a community of engaged supporters. A healthy nonprofit website typically needs both.
Remember that benchmarks vary widely based on your organization's size, sector, and audience. A local animal shelter shouldn't compare its metrics to those of a national health advocacy organization. Instead, focus on setting realistic goals based on your own historical data and steady improvement over time.
Creating Your Framework
Start by identifying 2-3 key metrics in each category that directly connect to your mission. For example, if increasing community education about environmental issues is central to your work, you might track:
- Awareness: Monthly visitors to your educational resources section
- Engagement: Average time spent on your learning materials
- Conversion: Number of resource downloads or workshop sign-ups
This focused approach ensures you're measuring what truly matters for your specific goals rather than getting distracted by metrics that don't connect to your mission.
To ensure your website supports these metrics effectively:
- How to Structure Your Nonprofit Website for Maximum Impact: A Complete Guide
- What Should a Nonprofit Website Include (20 Must-Have Features)
Essential Donation and Fundraising Metrics
For most nonprofits, online donations represent a critical function of their website. Understanding how well your donation process works can help you remove barriers and increase support for your mission.
Your total online donation amount is the most obvious metric, but tracking it properly means connecting your website analytics with your donation processing system. This integration helps you understand which pages, campaigns, or traffic sources are driving the most financial support.
Here are a few important donation and fundraising metrics to track:
- Donation Conversion Rate: This is the percentage of website visitors who complete a donation. This rate offers deeper insights than total amounts alone. Rates vary by organization type, but the nonprofit average typically ranges between 1-3% for general donation pages. Special campaigns with highly engaged audiences might see higher rates.
- Average Donation Size: This metric helps you understand donor behavior and can inform your suggested giving levels. If your average online gift is $45, but your suggested donation options start at $100, you might be creating an unintentional barrier for supporters.
- Recurring vs. One-Time Donation Ratio: The balance between recurring and one-time donations reveals the health of your sustainable funding. Recurring donors typically have much higher lifetime value, so tracking how many website visitors set up monthly giving versus one-time donations can guide your donor development strategy.
- Donation Form Abandonment: When someone starts but doesn't complete a donation, their donation form abandonment signals potential problems with your giving process. High abandonment rates might indicate your form is too long, lacks mobile optimization, or creates uncertainty for donors. Addressing these issues can quickly increase your donation completion rate.
Remember that even small improvements to your donation page can dramatically increase your organization's ability to fund its mission. Learn more about what makes a high-converting donation page work and how to test and improve your results over time.
Simple, Trustworthy, & Impact Driven: Why Childhelp’s Donation Form Works
The donation form on nonprofit Childhelp’s donation page is a great example of thoughtful, user-friendly design that encourages form completion.
Right at the top, there's a powerful impact statement—“Your donation makes a positive difference in the life of a child impacted by abuse and neglect”—which immediately shows donors the difference they can make. The form is clean and easy to follow, and it fits entirely on one screen, so there are no surprises about how long it will take to complete.
It’s easy to toggle between a one-time or recurring gift, and the preselected amounts help reduce decision fatigue (while the “Other Amount” box still enables visitors to customize their donation).

Finally, multiple payment options (credit card, digital wallet, or direct debit) make it easy to donate. Clear trust signals like their tax ID number and privacy policy build confidence and make it easy for donors to trust that their donation is in good hands.
Mobile Giving Trends
Users on desktop devices still make up the majority of donation transactions (55%) and revenue (70%), but the gap between mobile and desktop donation patterns has been narrowing for years.
Online donation pages saw average conversion rates of 11% on desktop devices and 8% on mobile devices last year–a difference of only 3%. If your mobile donation conversion rate is significantly lower than desktop, you're likely losing potential support. Monitor both rates separately to ensure your donation process works well across all devices.
Calculating return on investment (ROI) for digital fundraising campaigns connects your website metrics to your broader development goals. When you know which types of campaigns, messages, or channels produce the best results per dollar spent, you can allocate resources more effectively.
Donor retention metrics help you see if website visitors who make a first donation return to give again. Your website plays a crucial role in building ongoing relationships, so track how many donors make repeat gifts and how they interact with your site between donations.
The average donor retention rate among North American nonprofits was 46.6% from 2022-2023. You can use this as a benchmark for your donor retention rate goals.
For more strategies to improve your donation performance:
- 18 Proven Strategies to Increase Your Nonprofit Donations This Year
- Planned Giving Pages: Design and Content That Drives Legacy Gifts
- How to Promote a Fundraiser
Volunteer and Program Engagement Metrics
Beyond donations, your website should facilitate other forms of mission engagement. Tracking these interactions helps you understand how effectively your site connects people with your programs and opportunities.
Your volunteer sign-up conversion rate reveals how well your website transforms interest into action. If many people visit your volunteer page but few complete applications, you might need to clarify expectations, simplify the process, or better communicate the impact volunteers make.
We recommend tracking these volunteer and program engagement metrics to gain valuable insights about how you connect with potential supporters:
- Program Registration Metrics: These show which of your services generate the most interest and how effectively your website explains these offerings. Whether you're tracking sign-ups for classes, applications for assistance, or participation in campaigns, these numbers directly connect to your mission delivery.
- Resource Downloads: Downloads provide insight into which educational materials resonate with your audience. Each download represents someone taking a piece of your mission with them, whether it's a toolkit, guide, or informational material. Tracking which resources see the highest demand helps you create more of what your community values.
- Event Page Performance Metrics: These metrics help you understand how your website supports in-person or virtual gatherings. Beyond just tracking RSVPs, notice which event descriptions generate the most interest and which types of events attract new versus returning website visitors.
- Email Sign-Up Conversion Rate: Signing up for emails might seem like a small action, but it represents someone inviting your organization into their inbox—a significant step in building a relationship. A healthy email list often translates to more consistent support across all your activities.
Making It Easy to Volunteer in Just a Few Clicks
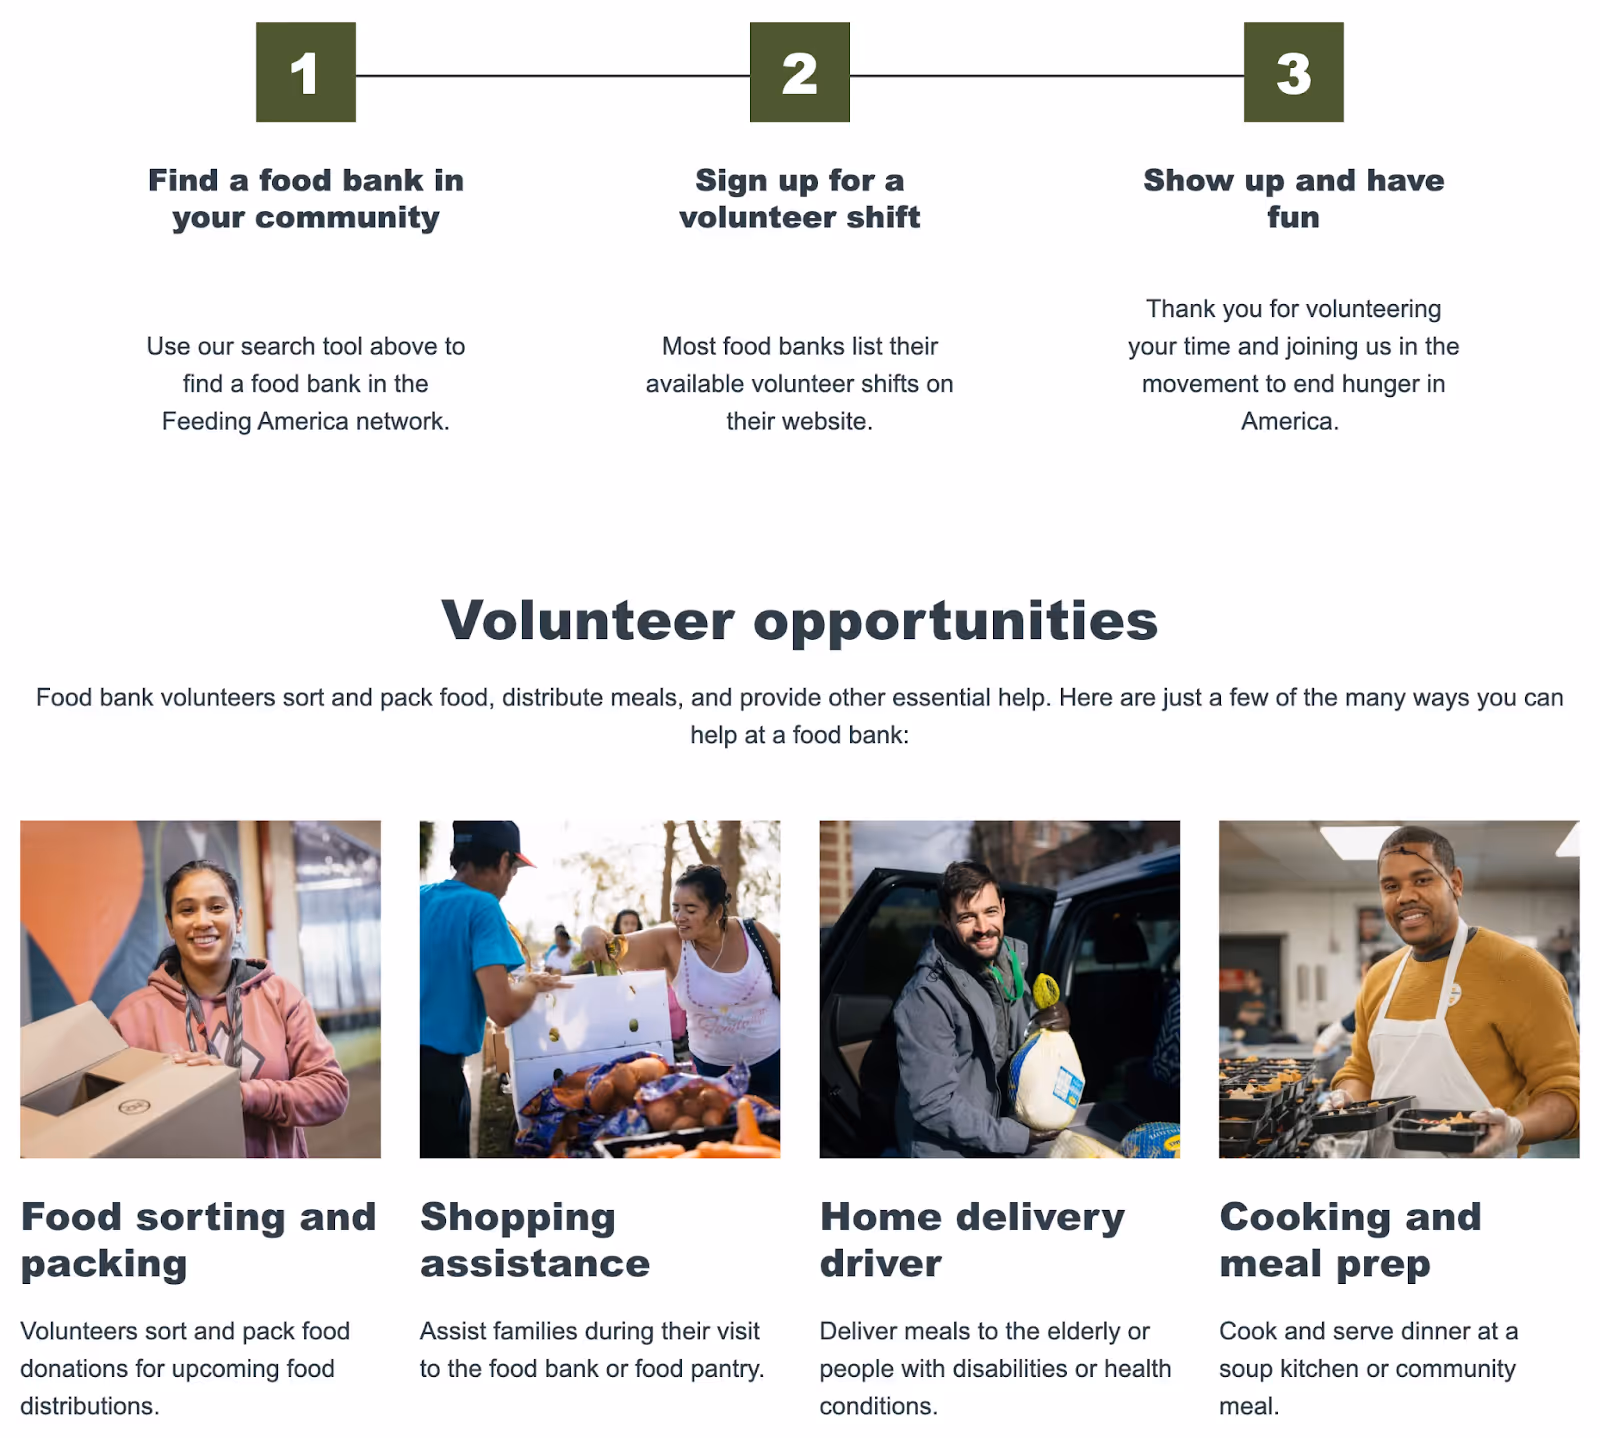
Feeding America’s volunteer page does a great job of showcasing just how meaningful your time can be while featuring a simple sign-up process that makes it easy to volunteer. The page is inviting and easy to navigate, with a simple zip code search that connects you to local opportunities in seconds.

The 3 simple steps to volunteering break it down so it doesn’t feel overwhelming, while the volunteer opportunities show uncertain page visitors exactly how they can help (sorting, shopping, delivering, or cooking). It’s not too much—there’s just the right amount of information to help you feel informed but not bogged down.
Plus, the photos and real-life examples make it clear that volunteers of all kinds are welcome, making it easy to say, “I can do that!” and take the next step.
The bottom of the page also showcases other ways to help aside from volunteering (hosting a food drive, fundraising, or making a donation). This ensures the organization still presents an opportunity to connect with visitors who aren’t quite ready to commit to volunteering.

Community Indicators
Community engagement indicators like comments, shares, and time spent on key pages reveal which content creates conversation around your cause. These interactions build community among supporters and extend your reach as people share your message with their networks.
Time spent on program or service pages helps you understand which aspects of your work generate the most interest. If visitors spend significantly more time learning about one program than others, it might indicate stronger public interest in that area of your work—or that other programs need clearer explanation.
To improve engagement through better content and storytelling:
- How to Tell Your Nonprofit's Story Through Web Design
- How to Write Effective Nonprofit Website Content: A Strategic Guide
- Nonprofit Testimonials: The Complete Guide to Collecting and Displaying Impact Stories
Content and Awareness Metrics
Understanding how people find and interact with your nonprofit website content helps you refine your message and reach more supporters. Metrics like these focus on the broader awareness of your organization and cause:
- Most Visited Pages: These reveal what aspects of your organization attract the most attention. Beyond your homepage, which programs, stories, or resources draw people in? These patterns help you understand what your audience finds most compelling about your work.
- Traffic Sources: Your traffic sources show how people discover your organization online. Are they finding you through Google searches, social media, partner organizations, or direct traffic? Each source represents a different relationship with potential supporters and requires different nurturing strategies.
- Search Visibility for Cause-Related Terms: This indicates whether people can find you when looking for organizations addressing issues you work on. If someone searches for "homeless services in [your city]" or "climate action volunteer opportunities," does your website appear in the results?
Identifying content that drives the most engagement helps you create more of what works. Which blog posts, stories, or resources keep people reading, sharing, and taking action? These insights can guide your content strategy and help you communicate your mission more effectively.
Smart Site Structure That Makes Finding Information Effortless
Beyond Type 1 is a great example of a nonprofit website that effectively organizes its content in a user-friendly way, making it easy for visitors to find relevant information about the cause. This organization, dedicated to providing resources and support for individuals with diabetes, has crafted an intuitive website that is content heavy without being overwhelming.
Its navigation menu is user-friendly and organized into clear categories, such as "Beyond Type 1," "Beyond Type 2," "Resources," "Programs," and "Who We Are." Each section contains tailored resource hubs that address specific topics, making it simple for users to locate content relevant to the organization or their specific needs.

For example, under the "Resources" tab, visitors can explore topics like advocacy, community, diabetes management, mental health, nutrition, and more–or they can search by content type. This structured approach ensures users can quickly access the information they're seeking.

By providing a well-organized navigation system and comprehensive resources tailored to each target audience segment, Beyond Type 1 effectively connects individuals with the information and support they need to manage diabetes and engage with their community.
For more content and SEO strategies:
- Nonprofit Website SEO: A Complete Guide
- Nonprofit Blog Ideas: How to Create Content Your Community Will Love
- Photography for Nonprofits: Ethics, Sourcing, and Impact
Google Ad Grant Performance
For nonprofits using the Google Ad Grant program (which provides up to $10,000 monthly in free advertising), tracking performance metrics is essential for maintaining eligibility and maximizing this resource.
We recommend starting with these key metrics:
- Click-Through Rates for Cause-Related Keywords: These show which terms resonate most with searchers. Knowing which phrases drive traffic helps you optimize your ad content and landing pages to better serve people looking for your services or ways to support causes like yours.
- Conversion Tracking for Grant-Funded Ads: Conversion tracking connects this free traffic to meaningful actions on your site. Without this connection, you might drive visitors who never engage with your mission. Set up proper tracking to ensure your ads lead to donations, sign-ups, or other mission-advancing actions.
- Geographic Reach and Local Engagement Metrics: These metrics help you understand where your supporters are located. These insights can inform program expansion, event planning, and targeted outreach efforts, especially for organizations with a specific geographic focus.
Setting Up Simple Tracking Systems
The thought of setting up website tracking might seem overwhelming, but you don't need to be a technology expert to gather useful data. Several straightforward tools can help you collect the metrics that matter most.
Google Analytics 4 offers a free, powerful way to track website performance. While it has many advanced features, even the basic implementation provides valuable information about your visitors and their behavior. The transition to this newer version might feel challenging, but it offers improved insights into how people interact with your site.
Setting up basic goals and conversion tracking in Analytics helps you measure specific actions that support your mission. Whether it's completing a donation, submitting a volunteer application, or downloading a resource, defining these actions as "conversions" lets you see how effectively your site guides people toward meaningful engagement.
Connecting Your Systems
Customer relationship management (CRM) integration connects website behavior to your constituent records, giving you a complete picture of how supporters interact with your organization. While the technical aspects of this integration might require assistance, understanding the connection helps you track the full journey from first-time website visitor to long-term supporter.
Key touchpoints to monitor between your website and CRM include:
- Donation completions
- Email sign-ups
- Event registrations
- Volunteer applications
Each successful connection represents someone moving deeper into a relationship with your organization.
Tracking What Matters: Easy Tools for Impactful Insights
Most nonprofit-friendly content management systems (like WordPress) offer analytics capabilities through plugins or built-in features. These tools can provide quick insights without requiring you to constantly check Google Analytics. Look for options that focus on the metrics most relevant to your mission rather than overwhelming you with data.
Free and low-cost tools make tracking easier for resource-constrained organizations. Services like Looker Studio (previously called Google Data Studio) allow you to create simple dashboards that automatically update with your most important metrics. This saves you time while keeping data accessible to your team.
Different metrics require different review frequencies. Daily monitoring makes sense for active campaigns or time-sensitive initiatives, while monthly or quarterly review works better for broader trends. Creating a simple schedule ensures you're getting insights when they're most useful for decision-making.
Additional technical considerations for your nonprofit website:
- The Complete Guide to Nonprofit Website Security
- Nonprofit Website Maintenance Guide
- Website Accessibility for Nonprofits: A Practical Guide
- Do Nonprofit Websites Need a Privacy Policy? A Complete Guide
Mobile-Specific Metrics and Optimization
With more than half of all web traffic now coming from mobile devices, understanding how supporters experience your site on phones and tablets is crucial for nonprofit success.
Your mobile traffic percentage shows how many supporters access your site on phones and tablets versus desktops. For many nonprofits, this number has grown steadily over the years and now represents the majority of visitors.
In 2024, 53% of all nonprofit web traffic came from mobile devices. If your mobile percentage is significantly lower than this industry average, you might have mobile usability issues driving people away.
Mobile conversion rates for key actions reveal whether supporters can easily complete important tasks on smaller screens. If your mobile donation conversion rate is much lower than your desktop rate, you're likely losing potential support due to a frustrating user experience.
Tracking Mobile User Experience Metrics
Be sure to track mobile UX metrics like:
- Load Time: This is how quickly your website loads, which directly affects whether visitors stay and engage or leave out of frustration.
- Bounce Rate: This is the percentage of visitors who leave your site after viewing only one page. A high bounce rate can be a sign they didn’t find what they needed or weren’t compelled to explore further.
- Engagement: This is a measure of how users interact with your site, such as clicking links, filling out forms, or watching videos. This metric shows how effectively your nonprofit website content holds their attention and drives action.
Tracking these metrics will help you identify specific problems and reveal opportunities for immediate improvement.
Case in Point: The Measurable Impact of a Strategic Redesign
When Atlanta Habitat for Humanity approached Trajectory about a complete website redesign, one of their key challenges was figuring out how to serve multiple distinct audiences through a single digital platform. The other challenge? Crafting a responsive website optimized for mobile users on the go.
Through a complete website audit and discovery process, including a review of key metrics in order to determine areas in need of improvement, we knew that we needed to make several strategic changes:
- Creation of clear pathways for each distinct audience through a complete structural overhaul
- Mobile-first design
- Website speed optimization

We designed a new website to transform Atlanta Habitat's digital presence, delivering measurable improvements across several key metrics:
- 65% decrease in page load times
- 55% boost in mobile engagement
- 45% reduction in support inquiries
- 40% faster average time-to-task completion
If you’re curious about how we streamlined the organization’s navigation and content organization while preserving the human stories at the heart of their work, dive into our website redesign case study.
Quicker Mobile Loading, Better Results: Why Speed Is Essential for Nonprofits
Keep in mind that mobile users typically have less patience for slow-loading pages and complicated navigation. In fact, 53% of mobile website visitors will abandon your site if it fails to load in 3 seconds or less. And donation page conversion rates can plummet by more than 450% when your page load time increases from 1 second to 4 seconds.
For many nonprofits, optimizing your website speed is one immediate improvement you can make to enhance user experience and keep people engaging with your site.
Measuring Mobile Effectiveness
You can measure responsive design effectiveness by comparing key metrics across devices. Well-designed responsive sites should show similar engagement patterns regardless of screen size, while significant disparities suggest optimization opportunities.
Google's free PageSpeed Insights will help you evaluate mobile performance without requiring technical expertise. This tool provides simple reports on your site's mobile usability along with specific recommendations for improvement.
Quick wins for improving mobile metrics often include:
- Simplifying navigation
- Reducing image file sizes
- Creating larger touch targets for buttons
- Ensuring forms work well on small screens
These changes can dramatically improve the experience for mobile supporters without requiring a complete nonprofit website redesign.
For design inspiration and platform considerations:
- The 12 Best Nonprofit Websites
- Nonprofit Landing Page Best Practices: A Comprehensive Guide
- Webflow for Nonprofit Websites: A Complete Guide
Turning Metrics into Action
Collecting data is just the first step—the real value comes from using these insights to strengthen your online presence and better serve your mission.
When you review your metrics regularly, patterns emerge that can help you spot website problems. If a page that previously performed well suddenly shows increased bounce rates or decreased conversions, something has likely changed that needs attention. Similarly, if certain content consistently outperforms everything else, you can learn from its characteristics.
Simple A/B testing allows nonprofits to make evidence-based improvements without technical expertise. By creating two versions of important pages or emails and seeing which performs better, you can continuously refine your approach based on real supporter behavior rather than assumptions.
Your metrics should directly guide your content calendar. If certain topics or story formats consistently generate more engagement and action, create more content in that vein. If your metrics show supporters are particularly interested in personal stories from program participants, for example, make those a regular feature of your communications.
Building a Culture of Measurement
Making budget decisions based on performance data helps ensure your limited resources go toward activities with the greatest mission impact. When considering website improvements, technology investments, or content creation, let your metrics guide your priorities.
Creating a culture of measurement at your organization doesn't mean turning everyone into data analysts. Instead, it means fostering an environment where decisions are informed by evidence rather than assumptions, and where learning and improvement are ongoing processes.
Start by sharing simple, relevant metrics with your team regularly. Focus on what the numbers mean for your mission rather than technical details. When everyone understands how website performance connects to program outcomes, metrics become a shared tool rather than an intimidating concept.
Common Metrics Challenges and Solutions
Every nonprofit faces obstacles when implementing measurement practices. Recognizing common challenges can help you navigate them more effectively.
Here are a couple of frequent challenges (and solutions):
- Limited Resources: Working with limited technical resources is a reality for most mission-driven organizations. Rather than trying to track everything, focus on setting up a few key metrics well. Many platforms offer templates and simplified reporting specifically designed for non-technical users.
- Small Sample Sizes: Small sample sizes can make data interpretation difficult for newer organizations or those with niche audiences. If your monthly website traffic is in the hundreds rather than thousands, look at longer time periods when analyzing trends. Focus more on directional patterns than specific percentage changes.
Balancing quantitative and qualitative feedback provides a more complete picture of your website's effectiveness. Numbers tell you what is happening, while feedback forms, support emails, and direct conversations with supporters help you understand why. Together, they give you the insights needed for meaningful improvement.
Avoiding Common Pitfalls
"Vanity metrics" that look impressive but don't connect to mission advancement can distract you from more meaningful measures. A spike in website traffic means little if none of those visitors engage with your cause.
Always ask: "How does this number help us better serve our mission?"
Getting buy-in from staff who feel intimidated by data often requires focusing on the stories behind the numbers. Show how metrics have led to specific improvements that advanced your mission. Introduce new tracking practices gradually, with clear explanations of their purpose.
These ethical considerations in tracking visitor behavior should guide your measurement practices:
- Always prioritize supporter privacy.
- Be transparent about what data you collect and why.
- Ensure your tracking methods align with your organization's values.
Measurement should never come at the expense of the trust your community places in you.
For nonprofits working with limited resources:
- Small Nonprofit Website Guide: Big Impact on a Small Budget
- Nonprofit Website Costs: A Complete Pricing Guide
- Nonprofit Website Development: How to Choose the Right Developer
Starting Your Metrics Journey
Implementing a comprehensive measurement strategy takes time, but you don't have to do everything at once. Begin with these foundational steps to build momentum on your nonprofit website.
Focus first on these three key metrics that connect directly to your mission:
- Conversion rate for your most important website action (whether that's donations, volunteer sign-ups, or program registrations)
- Traffic sources that bring engaged supporters to your site
- Content performance for pages that directly explain your mission and impact
These three metrics will give you actionable insights without overwhelming your team or systems.
Next, create a simple metrics action plan that outlines:
- Which specific metrics you'll track
- Who will be responsible for monitoring them
- How often you'll review the data
- What actions you'll take based on what you learn
Remember that metrics serve your mission, not the other way around. Every number you track should ultimately connect to your organization's reason for existing and help you better serve your community. When you approach measurement with this mindset, it becomes a powerful tool for advancing the change you seek to create in the world.
